Sunday, May 31, 2015

This 13th Century Tool Can Make You Serious Money Today

Every once in a while I like to circle back to some of the great questions I get from you.

Today, I want to dive into one from Suzanne P., who wants to know if "Fibos" can help her make money in the markets.

In a word, yes. But, you've got to understand what "Fibo" analysis is and how it works to make it profitable....

The Mathematical Sequence That Shows Up Everywhere

"Fibo" is short for Fibonacci - as in, Leonardo Fibonacci. Born in Pisa, Italy, around 1170, he's considered by many to be the single most influential western mathematician of the Middle Ages. His 1202 book, Liber Abaci ("Book of Calculation"), remains instrumental to our understanding of mathematics to this day and is filled with examples that applied to money-changing, interest calculation, and commercial bookkeeping, for example.

Today we know Leonardo simply as "Fibonacci," which is same name given to a numerical series in his book that he did not discover but that he used as an example. Despite their reputation as being difficult or complex, in reality, Fibonacci numbers are easy to learn and easy to understand.

The sequence, if you're counting, looks like this... 1 1 2 3 5 8 13 21 34 55 and so on.

Right away you can see a pattern. One plus one equals two. One plus two equals three. Two plus three equals five. And so on.

But if you look closer, something else emerges. Every number in the series is approximately 0.618-to-1 in terms of its relationship to the number after it. This ratio never changes because the proportion remains the same.

This is important so don't lose that thought; we're going to come back to it in a minute.

What's simply amazing to me is that Fibonacci (and lots of scientists after him) have found Fibonacci numbers in nature. For example, the number of petals on flowers is often a Fibonacci number, as are the number of "cells" in a pineapple's skin. Pinecones, sunflowers, beehives... they all display Fibonacci's numbers or sequence in some way.

More amazingly, plant leaves are often arranged in spirals or shapes that, when counted, are found to be adjacent Fibonacci numbers. In fact, if you divide the arc they form along a vine, for example, the arc length angle ratio is equal to 137.5 degrees. The numbers are so consistent that the relationship is actually called the "Golden Ratio" or the "Golden Mean."

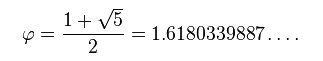
Mathematically, it looks like this, where the Greek letter phi represents the golden ratio:


Geometrically, if you draw it out, the Fibonacci ratio or "Golden Mean," if you prefer, looks like this...
13th century tool

These relationships can be found all over the place in the natural world in everything from dolphins' fin sections to the ratio between human forearms and hands. Even the cochlea in our inner ear is a "golden" spiral adhering to this set of proportions.

Fibonacci numbers and ratios can also be found - you guessed it - in the stock market.

Fibo and Equities

Admittedly, a lot of people have problems coming to terms with this. The data is a dubious fit, they say. Or, the computerization makes a natural order impossible, they challenge.

13th century tool

I disagree. The stock market represents the combined inputs and decision making of millions of participants at once. That means it is more like a living, breathing system than a static one. So while computers may temporarily change things, the natural order of human decision making is still very much a part of how markets work. Which means you can use the Golden Mean and the Fibonacci sequence to analyze them if you know what you are doing.

For example, you can apply Fibonacci numbers to include range and retracement like this using a common tool known as the Fibonacci Arc, seen here on the right.

Notice how price tends to move from one key "Fibonacci" level to another, especially when it comes to spotting likely reversals or breakdowns.

13th century toolThe Fibonacci sequence can also be applied to time, as at left. I particularly like this type of Fibonacci analysis because knowing how time passes can help me understand whether trends are likely to continue or falter.

By the way, most online trading packages and analytics now include drawing tools based on the Fibonacci series. So even if you are mathematically challenged like I am, you can still harness the power inherent in the numbers.

Start by "anchoring" on a recent major swing high or low if you're a day trader. If you're an investor with a multi-year perspective, I think a major market turning point is more appropriate.

Then, extend the Fibonacci ratio or tool to subsequent turning points. What you are looking for is the "fit" between properly scaled charts and the Fibonacci tool you are using - be it arcs, lines, or ratios, for example.

You'll know you have it when prices line up along key lines and intervals. Then you can look to what traders call the "hard right edge" or the last data point you have available and predict likely future turning points and market trends, as well as potential breakouts and key reversal levels, even though they haven't happened yet - often with remarkable accuracy.

This, in turn, gives you an edge because you can be "on guard" for market movements that will take others by surprise.

Let me show you...

The Predictive Power of Fibonacci 13th century tool

The 57 % decline from October 2007 highs to March 2009 lows established an analytical anchor for the rally that built all the way to April 2010 when the markets had their first hiccup. Not coincidentally, the S&P 500 Index tacked on 83% over 13 months covering - drum roll, please - approximately 61.8% of the distances from the 2007 peak to the March 2009 low.

What's more, Fibonacci analysis suggested that the pullback would peter out around 1010 despite the fact that millions of investors thought we were one leg away from another financial apocolypse. In fact, it held at 1,008, which is almost smack on the 38.2% Fibonacci retracement level suggested by the Fibonacci series and, in turn, the converse of the Golden Ratio.

Subsequently, the index reversed and marched higher through May 2011, peaking just shy of the 78.6% before falling again to its next logical retracement level of 50% before taking off in earnest to where we are today.

Obviously there is an element of subjective interpretation here, but you cannot deny the fact that Fibonacci analysis helped investors identify each of these important market turning points months in advance.

This stuff is so good that I like to joke that if you put 5 Fibonacci practioniers in a room you will get 10 opinions about where the markets are headed.

All joking aside, though, no two investors have the same time frame or risk tolerances. So the fact that there is a difference in opinion is vindication that Fibonacci numbers can help you spot opportunities others don't see.

My good friend, Tom Gentile, agrees. Tom, who co-founded Optionetics, is one of the world's leading Fibonacci practioners. He believes "that there's definitely something there," which is why he uses both the Fibonacci ratio and the Golden Mean to pick entry prices and profit targets as part of his trading routine and as a complement to other analysis.

Knowing what I've just explained, you now have the power to do the same thing.

At the end of the day, there is no "Holy Grail," but the fact that an 800-year-old indicator works just as well today as it did centuries ago means there could be.

From the Editor: Do you have a question for Keith to address in a future "Marketology" column? E-mail him at customerservice@moneymorning.com and ask away. He'd love to hear from you.

Thursday, May 28, 2015

4 Hot Stocks to Trade (or Not)

BALTIMORE (Stockpickr) -- Put down the 10-K filings and the stock screeners. It's time to take a break from the traditional methods of generating investment ideas. Instead, let the crowd do it for you.

>>3 Big-Volume Stocks in Breakout Territory

From hedge funds to individual investors, scores of market participants are turning to social media to figure out which stocks are worth watching. It's a concept that's known as "crowdsourcing," and it uses the masses to identify emerging trends in the market.

Crowdsourcing has long been a popular tool for the advertising industry, but it also makes a lot of sense as an investment tool. After all, the market is completely driven by the supply and demand, so it can be valuable to see what names are trending among the crowd.

While some fund managers are already trying to leverage social media resources like Twitter to find algorithmic trading opportunities, for most investors, crowdsourcing works best as a starting point for investors who want a starting point in their analysis. Today, we'll leverage the power of the crowd to take a look at some of the most active stocks on the market today.

>>5 Stocks to Sell Before It's Too Late

These "most active" names are the most heavily-traded names on the market -- and often, uber-active names have some sort of a technical or fundamental catalyst driving investors' attention on shares. And when there's a big catalyst, there's often a trading opportunity.

Without further ado, here's a look at today's stocks.

Under Armour

Nearest Resistance: $54

Nearest Support: $50

Catalyst: Stock Split

Shares of sports apparel maker Under Armour (UA) are seeing big volume this afternoon, following a 2-for-1 stock split that went effective today. Under Armour has been a big momentum name over the last year, rallying more than 81% since April 2013, so it's not that surprising that UA was one of the names that's been correcting hard in 2014. But that doesn't mean that UA is in free-fall right now; in fact, shares are holding sideways in consolidation-mode.

The key levels to watch in UA right now are resistance at $54 and support at $50. Those are the price levels that buyers and sellers are battling it out between right now. A breakout above $54 makes UA a high-probability buy.

The Coca-Cola

Nearest Resistance: $41

Nearest Support: $39

Catalyst: Earnings

Beverage giant Coca-Cola (KO) is rallying more than 4% this afternoon, buoyed by strong earnings and a broad market that's fading hard in favor of blue chips as Tuesday's session drags on. Coke earned 36 cents per share for the first quarter, a number that got hit by currency conversion charges. Excluding currency charges, the firm met analyst expectations with non-GAAP earnings of 44 cents.

From a technical standpoint, today's 4% pop is solid, but it's far from meaningful. Shares broke out today, but they're still very close to a more important resistance level at $41. Be wary of buying KO until shares can catch a bid above that $41 price. There's more downside risk than upside potential at current levels.

J.C. Penney

Nearest Resistance: $8

Nearest Support: $6

Catalyst: Technical Setup

Meanwhile, shares of department store retailer J.C. Penney (JCP) are selling off this afternoon, shoved lower thanks to a textbook technical setup that's been setting up since the start of March. JCP has been forming a double-top pattern for the last month and a half, triggering a sell signal with Friday's breakdown through the $8 level.

The complete inability of J.C. Penney to catch a bid here is a big problem for longs right now. While support at $6 is far below, I wouldn't put too much faith in buyers down there. $5 is the next important support level if $6 fails.

Vale

Nearest Resistance: $14.75

Nearest Support: $12

Catalyst: Dividend, Brazil ADR Selloff

Shares of Vale (VALE) are getting hammered 5.8% lower as I write this afternoon, pushed down by a combination of a big dividend distribution and a broad selloff in commodity-driven Brazilian ADRs today. A quick glance at this chart should be all it takes to see that the primary trend is down in Vale. In fact, shares have been tracking down in a textbook channel since last fall. This latest bounce off of trend line resistance in April is a good opportunity to sell again.

I'd avoid the long-side of this stock until it can break out of its downtrend.

To see these stocks in action, check out the at Most-Active Stocks portfolio on Stockpickr.


-- Written by Jonas Elmerraji in Baltimore.


RELATED LINKS:


>>5 REIT Trades Worth Buying in April


>>5 Rocket Stocks for a Tumbling Market


>>5 Stocks Poised for Breakouts

Follow Stockpickr on Twitter and become a fan on Facebook.

At the time of publication, author had no positions in stocks mentioned.

Jonas Elmerraji, CMT, is a senior market analyst at Agora Financial in Baltimore and a contributor to

TheStreet. Before that, he managed a portfolio of stocks for an investment advisory returned 15% in 2008. He has been featured in Forbes , Investor's Business Daily, and on CNBC.com. Jonas holds a degree in financial economics from UMBC and the Chartered Market Technician designation.

Follow Jonas on Twitter @JonasElmerraji


Wednesday, May 27, 2015

MeetMe: Right Stock, Wrong Time (MEET)

With today's 15% pop just staring you in the face, it would be tempting for current MeetMe Inc. (NYSEMKT:MEET) shareholders to lock their profit in and walk away. It would also be a mistake, though. See, while MEET is admittedly a volatile mess in the short run, for the long haul, there's a lot more upside left to tap.

If the idea and the ticker seem familiar, it may be because yours truly penned some bullish thoughts on MEET back on February 7th.... and October 29th, and October 23rd, and October 18th, and July 18th, and July 8th.... you get the idea. And, while it's been an exhausting journey with lots and twists and turns, MeetMe Inc. shares are now up 60% since my love affair with the stock began back in the middle of last year.

I don't come here to gloat, however. I'm revisiting MeetMe again today to reiterate a point I've made about it several times since starting to log the saga - there's a ton of upside potential here, that could last for months, and end up creating strong triple-digit gains. You just have to take a step back and look at a long-term, weekly chart of MEET to see it. So, that's what we'll do.

There are two things to note about this longer-term chart: (1) Although it's been up-and-down for years, as of the past few months, there's more 'up' than 'down' for MEET now [see the rising MACD lines, both now above the zero level], and, (2) there's plenty of volume behind the current bullishness from MeetMe, telling us it's got the participation it needs to last [one of the missing ingredients of the prior breakout attempts].

Between those two nuances and the fact that this stock was trading at $10.00 just a few years ago, there's a ton of room to recover here... and MeetMe Inc. is acting like it wants to use all of that potential.

With all of that being said, as bullish as MEET may be in the long run, today isn't the time to step into a new trade. Between this morning's opening gap and the stock's usual ebb and flow, odds are good that MeetMe shares could pull back to the $2.50-ish level again sooner than later. That's the spot where you'd want to wade into this impressive but admittedly volatile long-term uptrend.

For more trading ideas and insights like these, be sure to sign up for the free SmallCap Network newsletter. You'll get stock picks, market calls, and more, every day. Here's what you've missed recently.

Monday, May 25, 2015

Twitter shares tumble after earnings report

SAN FRANCISCO — Twitter CEO Dick Costolo on Wednesday came out pitching the case for the service's mainstream potential as the company faced growth concerns in its first financial report to Wall Street since going public.

Twitter beat Wall Street's sales and profit forecasts, but shares nose-dived more than 17% in after-hours trading on lackluster user growth and engagement figures.

"We can increase high-quality interactions and make it more likely that new or casual users will find the service as indispensable as our existing core users do," Costolo said on the company's conference call.

Share of Twitter plummeted $11.59, to $54.38, following its letdown that monthly active users came in at 241 million, a 30% year-over-year increase but well below expectations. Twitter's engagement dropped to 148 billion Timeline Views, an 11 billion decline from the previous quarter.

SHINAL: Wall Street has yet to learn Twitter's language

"What twitter needs to prove is two things, that they can dramatically increase engagement with advertisers and they can dramatically increase engagement with users. The market is now questioning whether they can go mainstream," said RBC Capital Markets analyst Mark Mahaney.

The company, based here, reported $9.8 million in net income, or 2 cents per share, on $243 million in revenue.

Twitter was expected to report a loss of $13 million in net income on $218 million in revenue in the quarter, according to the survey of estimates from Thomson Reuters. Analysts were predicting a loss of 2 cents per share.

Twitter said in its earnings report that it now sees 75% of its advertising revenue from mobile, up from 70% in the previous quarter.

Shares of Twitter have seen a 47% run-up in trading since the company went public Nov. 7.

"We feel very well positioned for growth in 2014," said Costolo.

Twitter has a lofty valuation relative to its peers. Twitter is valued at about $37 billion, or nearly 33 times estimated 2014 sales! of $1.2 billion. Meanwhile, Facebook trades at 14 times this year's sales forecasts while LinkedIn is at 12 times.

Also of concern, Twitter's deceleration of monthly active users, a closely watched measurement, raises questions about its ability to continue to grow as steadily as Facebook.

The company faces some headwinds in lock-up expirations on its stock as well. About 9.9 million shares will become eligible for sale by non-executive insiders on Feb. 15, and on May 7 it's expected that 454.3 million shares held by all insiders will lose trading restrictions, putting downward pressure on the stock.

"My guess is that Twitter will be successful long term in re-accelerating user engagement," said Mahaney.

Sunday, May 24, 2015

Target Confirms PINs Stolen in Card-Data Breach

Target Data BreachSteven Senne/AP ATLANTA -- Target said Friday that debit-card PINs were among the financial information stolen from millions of customers who shopped at the retailer earlier this month. Target (TGT) said the stolen personal identification numbers, which customers type in to keypads to make secure transactions, were encrypted and that this strongly reduces risk to customers. In addition to the encrypted PINs, customer names, credit and debit card numbers, card expiration dates and the embedded code on the magnetic strip on back of the cards were stolen from about 40 million credit and debit cards used at Target stores between Nov. 27 and Dec. 15. Security experts say it's the second-largest theft of card accounts in U.S. history, surpassed only by a scam that began in 2005 involving retailer TJX Cos. (TJX). Target said it doesn't have access to nor does it store the encryption key within its system, and the PIN information can only be decrypted when it is received by the retailer's external, independent payment processor. "We remain confident that PIN numbers are safe and secure," spokeswoman Molly Snyder said in an emailed statement Friday. "The PIN information was fully encrypted at the keypad, remained encrypted within our system, and remained encrypted when it was removed from our systems." The company maintains that the "key" necessary to decrypt that data never existed within Target's system and couldn't have been taken during the hack. However, Gartner security analyst Avivah Litan said Friday that the PINs for the affected cards aren't safe and people "should change them at this point." Litan said that while she has no information about the encrypted PIN information in Target's case, such data has been decrypted before, in particular the 2005 TJX Cos. hacking case that's believed the largest case of identity theft in U.S. history. In 2009 computer hacker Albert Gonzalez plead guilty to conspiracy, wire fraud and other charges after masterminding debit and credit card breaches in 2005 that targeted companies such as T.J. Maxx, Barnes & Noble (BKS) and OfficeMax. Gonzalez's group was able to decrypt encrypted data. Litan said changes have been made since then to make decrypting more difficult but "nothing is infallible." "It's not impossible, not unprecedented [and] has been done before," she said. Besides changing your PIN, Litan says shoppers should opt to use their signature to approve transactions instead because it is safer. Still, she said Target did "as much as could be reasonably expected" in this case. "It's a leaky system to begin with," she said. Credit card companies in the U.S. plan to replace magnetic strips with digital chips by the fall of 2015, a system already common in Europe and other countries that makes data theft more difficult. Minneapolis-based Target Corp. said it is still in the early stages of investigating the breach. It has been working with the Secret Service and the Department of Justice. -.

Wednesday, May 20, 2015

Ron Burgundy film is second, but RV first in yuks

Ron Burgundy, of Dodge Durango TV and online ad fame, finished the weekend in second place in the box office listings. But that's not bad considering the competition, and that the Will Ferrell comedy, Anchorman 2: The Legend Continues, may be considered one of the top driving movies of the year.

Yes, driving. The absurdist comedy features bowling balls, scorpions and really bad driving, especially when it comes to a vintage motor home that rolls over.

But getting what looks to be an old General Motors RV to actually perform the needed rollover was a monumental task.

While Will Ferrell, Steve Carell, Paul Rudd and David Koechner had a great time yukking it up, pretending to roll in the crash against a green screen background.

Writer-director McKay has called it "a giant pain in the ass" to get the scene for the scene he and Ferrell wrote at two in the morning. It ended up taking three days to shoot.

But McKay had his hands full with the real exterior shots of the dramatic rollover crash.

He hired one of the best Hollywood stuntmen going and three old RVs to make sure he got the shot. But the trailer just wouldn't perform the shot.

"It's insane, there's no way we could get it to roll," says McKay. "It's just such an oddly shaped vehicle."
"We really had to find the right angle to do it," he adds. "We did three tries, and we finally got the roll and the shot we needed on the last one. Thank God."

Tuesday, May 19, 2015

Why Rovi Shares Got Wrecked

Although we don't believe in timing the market or panicking over market movements, we do like to keep an eye on big changes -- just in case they're material to our investing thesis.

What: Shares of Rovi (NASDAQ: ROVI  ) have lost nearly 12% today as a result of the company's disappointing earnings report. Both top and bottom lines missed estimates, and the company is now contemplating divestitures to keep itself afloat.

So what: Rovi's third-quarter earnings report showed a 13% year-over-year decline in revenue to $143 million, which was weaker than the $152 million Wall Street had modeled. Rovi's GAAP net loss was $0.12 per share, which is slightly better than the $0.13 GAAP EPS loss from the year-ago quarter, but adjusted earnings of $0.41 per share were a big swing-and-a-miss at the $0.48 analyst target.

Going forward, Rovi now expects annual revenue of $585 million to $615 million, which barely reaches the $613.5 million consensus on the high end. It's the second consecutive guidance downgrade for this fiscal year. Rovi's full-year EPS guidance of $1.70 to $2.00 is slightly better, as Wall Street is looking for $1.94 per share, but it is also a downgrade from earlier guidance. As a result of this weakness, Rovi is now actively investigating the sale of its DivX video codec business.

Now what: Two consecutive guidance downgrades and a divestiture on the horizon? This doesn't exactly paint a picture of health for Rovi. If you're interested in possible deep-value turnaround stories, you may want to dig deeper, but this company's momentum appears to be moving in the wrong direction. I'd stay on the sidelines until more clarity emerges on the DivX sale, at least.

Want more news and updates? Add Rovi to your watchlist now.

Invest in real growth
Tired of watching your stocks creep up year after year at a glacial pace? Motley Fool co-founder David Gardner, founder of the No. 1 growth stock newsletter in the world, has developed a unique strategy for uncovering truly wealth-changing stock picks. And he wants to share it, along with a few of his favorite growth stock superstars, WITH YOU! It's a special 100% FREE report called "6 Picks for Ultimate Growth." So stop settling for index-hugging gains... and click HERE for instant access to a whole new game plan of stock picks to help power your portfolio.

Wednesday, May 13, 2015

Honoring the firms with the best practices

InvestmentNews today announced the winners of the first annual Best Practices awards, acknowledging 24 advisory firms in two categories, human capital management and technology.

Award winners were honored at a best practices workshop in Chicago.

The awards were given based on results from the InvestmentNews Compensation and Staffing Study, as well as personal interviews.

The winners are as follows:

Human Capital Management, Industry Innovators:

Balasa Dinverno Foltz LLC, Itasca, Ill., bdfllc.com

Briaud Financial Advisors, College Station, Texas, briaud.com

Fish & Associates, Memphis, Tenn., fishandassociates.com

JMG Financial Group Ltd., Oak Brook, Ill., jmgfinancial.com

JVL Associates LLC, Wyoming, Mich., jvlassociates.com

Singer Xenos Wealth Management, Coral Gables, Fla., singerxenos.com

Human Capital Management, Top-Performing firms:

Johnson Carriar Kruchten Anderson & Associates, Saint Cloud, Minn., ameripriseadvisors.com

Pinnacle Advisory Group Inc., Columbia, Md., pinnacleadvisory.com

Rinvelt & David LLC, Grand Rapids, Mich., rinveltdavid.com

Roof Advisory Group Inc., Harrisburg, Pa., roofadvisory.com

Vintage Financial Services LLC, Ann Arbor, Mich., vintagefs.com

Willow Street Advisors LLC, Naples, Fla., willowstreetadvisors.com

Overall Use of Technology, Industry Innovators:

Empirical Wealth Management, Seattle, empirical.net

Financial Plan Inc., Bellingham, Wash., financialplaninc.com

Joseph Barry Co. LLC, New Bedford, Mass., josephbarry.com

Searcy Financial Services Inc., Overland Park, Kan., searcyfinancial.com

Strategic Capital Allocation Group LLC, Boston, scagrp.com

The Arkansas Financial Group Inc., Little Rock, Ark., arfinancial.com

Overall Use of Technology, Top-Performing Firms:

Bedrock Capital Management Inc., Los Altos, Calif., bedrockcapital.com

Budros Ruhlin & Roe Inc., Columbus, Ohio, b-r-r.com

Evensky & Katz LLC, Coral Gables, Fla., evensky.com

Roof Advisory Group Inc., Harrisburg, Pa., roofadvisory.com

Shelton Financial Group Inc., Fort Wayne, Ind., sheltonfinancial.com

Yellow Brick Road Financial Advisors LLC, San Francisco, ybrfinancialadvisors.com

Tuesday, May 12, 2015

Pandora Drops on Secondary Offering

NEW YORK (TheStreet) -- Pandora Media (P) shares dropped 3.9% to $23.06 after the music-streaming company filed a secondary share offering.

In the proposed filing, Oakland-based Pandora said it will sell 10 million additional shares, and another 4 million shares from current stockholders.

To appease the bankers on the deal, Pandora said in a filing that it "intends to grant the underwriters a 30-day option to purchase up to an additional 2,100,000 shares to cover over-allotments, if any."

Pandora said it expects to use the proceeds "for general corporate purposes, including working capital and capital expenditures." Also included in the offering, Pandora said it may use the proceeds for acquisitions. The lead bookrunners on the offering will be J.P. Morgan and Morgan Stanley. Wells Fargo Securities, BofA Merrill Lynch, BMO Capital Markets, Canaccord Genuity, Needham & Company, Pacific Crest Securities, Piper Jaffray and William Blair are acting as co-managers. --Written by Chris Ciaccia in New York >Contact by Email. Follow @Chris_Ciaccia

Sunday, May 10, 2015

5 Stocks Under $10 Making Big Moves

DELAFIELD, Wis. (Stockpickr) -- At Stockpickr, we track daily portfolios of stocks that are the biggest percentage gainers and the biggest percentage losers.

>>5 Big Trades You Can't Miss This Week

Stocks that are making large moves like these are favorites among short-term traders because they can jump into these names and try to capture some of that massive volatility. Stocks that are making big-percentage moves either up or down are usually in play because their sector is becoming attractive or they have a major fundamental catalyst such as a recent earnings release. Sometimes stocks making big moves have been hit with an analyst upgrade or an analyst downgrade.

Regardless of the reason behind it, when a stock makes a large-percentage move, it is often just the start of a new major trend -- a trend that can lead to huge profits. If you time your trade correctly, combining technical indicators with fundamental trends, discipline and sound money management, you will be well on your way to investment success.

>>5 Stocks Under $10 Hedge Funds Love

With that in mind, let's take a closer look at a several stocks under $10 that are making large moves to the upside today.

Salem Communications

Salem Communications (SALM) is a domestic multimedia company with integrated business operations covering radio broadcasting, publishing and the Internet. This stock closed up 8.8% to $7.84 in Thursday's trading session.

Thursday's Range: $7.23-$7.87

52-Week Range: $4.62-$10.14

Thursday's Volume: 62,000

Three-Month Average Volume: 38,783

>>5 Stocks Warren Buffett Is Buying in 2013

From a technical perspective, SALM bounced sharply higher here right above some near-term support at $7.20 and back above its 50-day moving average at $7.73 with above-average volume. This stock has been trending sideways for the last three months and change, with shares moving between $7 on the downside and $8.22 on the upside. Shares of SALM are now quickly moving within range of triggering a major breakout trade above the upper-end of its recent sideways trading chart pattern. That breakout will hit if SALM manages to take out some near-term overhead resistance levels at $8 to $8.22 with high volume.

Traders should now look for long-biased trades in SALM as long as it's trending above some key near-term support levels at $7.20 or above its 200-day at $6.95 and then once it sustains a move or close above those breakout levels with volume that hits near or above 38,783 shares. If that breakout triggers soon, then SALM will set up to re-test or possibly take out its next major overhead resistance levels at $9.27 to $10.

Key Energy Services

Key Energy Services (KEG) provides well services to oil companies, foreign national oil companies and independent oil and natural gas production companies. This stock closed up 5.7% to $6.84 in Thursday's trading session.

Thursday's Range: $6.48-$6.94

52-Week Range: $5.61-$9.57

Thursday's Volume: 1.42 million

Three-Month Average Volume: 2.39 million

>>Hedge Funds Hate These 7 Stocks -- but Should You?

From a technical perspective, KEG ripped higher here right above its 50-day moving average of $6.39 with lighter-than-average volume. This move is quickly pushing shares of KEG within range of triggering a major breakout trade. That trade will hit if KEG manages to take out some near-term overhead resistance levels at $6.89 to its 200-day moving average at $7 with high volume.

Traders should now look for long-biased trades in KEG as long as it's trending above its 50-day at $6.39 or above more support at $6.06 and then once it sustains a move or close above those breakout levels with volume that hits near or above 2.39 million shares. If that breakout triggers soon, then KEG will set up to re-test or possibly take out its next major overhead resistance levels at $7.35 to $7.89. Any high-volume move above those levels will then put its next major overhead resistance levels at $8.25 to $8.92 within range for shares of KEG.

Mecox Lane

Mecox Lane (MCOX) offers a selection of products apparel, accessories and home and health care products through its online platform and third party e-commerce Web sites. This stock closed up 9.5% to $3.66 in Thursday's trading session.

Thursday's Range: $3.23-$3.80

52-Week Range: $1.67-$7.88

Thursday's Volume: 179,000

Three-Month Average Volume: 207,259

>>5 Stocks With Big Insider Buying

From a technical perspective, MCOX bounced sharply higher here right above its 200-day moving average of $3.06 with decent upside volume. This stock recently pulled back sharply from its high of $7.88 to its recent low of $3.30. During that pullback, shares of MCOX have been consistently making lower highs and lower lows, which is bearish technical price action. That said, shares of MCOX might be ready to see its downside volatility cease, and the stock spike sharply higher.

Traders should now look for long-biased trades in MCOX as long as it's trending above its recent low at $3.30 or above its 50-day at $2.98 and then once it sustains a move or close above some near-term overhead resistance at $4 with volume that hits near or above 207,259 shares. If we get that move soon, then MCOX will set up to re-test or possibly take out its next major overhead resistance levels at $4.76 to its gap down day high at $5.15. Any high-volume move above those levels will then give MCOX a chance to re-fill some of its previous gap down zone from this month that started at $7.88.

Yingli Green Energy

Yingli Green Energy (YGE) engages in the design, development, marketing, manufacture, installation and sale of photovoltaic products. This stock closed up 1.9% to $4.19 in Thursday's trading session.

Thursday's Range: $3.93-$4.27

52-Week Range: $1.25-$4.83

Thursday's Volume: 6.62 million

Three-Month Average Volume: 4.45 million

>>5 Stocks Rising on Unusual Volume

From a technical perspective, YGE spiked modestly higher here right above its 50-day moving average of $3.68 with heavy upside volume. This stock recently formed a double bottom chart pattern at $3.57 to $3.55. Following that bottom, shares of YGE have started to trend higher and move within range of triggering a major breakout trade. That trade will hit if YGE manages to take out some near-term overhead resistance levels at $4.40 to its 52-week high at $4.83 with high volume.

Traders should now look for long-biased trades in YGE as long as it's trending above some key near-term support at $3.55 and then once it sustains a move or close above those breakout levels with volume that hits near or above 4.45 million shares. If that breakout hits soon, then YGE will set up to enter new 52-week-high territory, which is bullish technical price action. Some possible upside targets off that breakout are its next major overhead resistance levels at $6.27 to $7.

Nautilus

Nautilus (NLS), a fitness products company, provides solutions to help people achieve a fit and healthy lifestyle. This stock closed up 4.7% to $6.79 in Thursday's trading session.

Thursday's Range: $6.49-$6.88

52-Week Range: $2.28-$9.87

Thursday's Volume: 338,000

Three-Month Average Volume: 487,173

>>5 Heavily Shorted Stocks That Hedge Funds Love

From a technical perspective, NLS jumped higher here right above its 200-day moving average of $6.37 with lighter-than-average volume. This stock recently dropped sharply from its high of $9.87 to its low of $6.15 with heavy downside volume. During that drop, shares of NLS have been consistently making lower highs and lower lows, which is bearish technical price action. That said, shares of NLS have held above its 200-day following the drop, and the stock now looks ready to cease its downside volatility. Shares of NLS are starting to move within range of triggering a near-term breakout trade. That trade will hit if NLS manages to clear some near-term overhead resistance at $6.99 with high volume.

Traders should now look for long-biased trades in NLS as long as it's trending above its 200-day at $6.37 or above more near-term support at $6.15 and then once it sustains a move or close above $6.99 with volume that hits near or above 487,173 shares. If that breakout hits soon, then NLS will set up to re-test or possibly take out its next major overhead resistance levels $8 to its 50-day at $8.25.

To see more stocks that are making notable moves higher today, check out the Stocks Under $10 Moving Higher portfolio on Stockpickr.

-- Written by Roberto Pedone in Delafield, Wis.


RELATED LINKS:


>>5 Stocks Under $10 Set to Soar


>>The Icahn Effect: Is Apple the Next Netflix?


>>5 New Trades From Renaissance Technologies

Follow Stockpickr on Twitter and become a fan on Facebook.

At the time of publication, author had no positions in stocks mentioned.

Roberto Pedone, based out of Delafield, Wis., is an independent trader who focuses on technical analysis for small- and large-cap stocks, options, futures, commodities and currencies. Roberto studied international business at the Milwaukee School of Engineering, and he spent a year overseas studying business in Lubeck, Germany. His work has appeared on financial outlets including

CNBC.com and Forbes.com. You can follow Pedone on Twitter at www.twitter.com/zerosum24 or @zerosum24.