In January 2014, the stock market benchmark S&P 500 lost 3.36% after an excellent 2013. The enthusiasm came back as the market gained 4.31% over February. In March, it went up only 0.69%. In April, it was about even for the whole month. In May, the market gained 2.1% and in June, the S&P 500 went up 1.91%. In July, the market went down by 1.51%. However, the market gained 3.77% over August, which was the second-biggest monthly gain since 2014. Throughout September, the market declined 1.55%.
The U.S. bull market has lasted for 67 months up until now, and it is the fifth longest bull market in history. The market went higher during the last few years despite concerns that the market has already reached the top, yet a recent fall had investors worried. Has the U.S. stock market reached the turning point?


Though the S&P 500 was down by 1.32% on the first day of October, billionaire investor Warren Buffett told CNBC on Thursday he bought stocks in Wednesday's big selloff. Buffett said he likes to buy stocks when they go down, not when they go up: "The more it goes down, the more I like to buy." He said he buys businesses that he thinks will be good for the next 50 years, such as the deal to buy the nation's largest privately-held car dealership group, Van Tuyl Group.
In Chris Davis' Davis Financial Fund Semi-Annual Review 2014, he gives some perspectives on the current market environment:
"Over the past several years, stock prices have advanced steadily and now trade above their levels prior to the financial crisis of 2008–2009. From the depths of the crisis to the present time, what is most remarkable in our view is the market's incredible resilience. Since the stock market is really a market of individual stocks, the market's recovery reflects the resilience of the underlying individual businesses and the durability of their earnings power. Many financial businesses have successfully built fortress balance sheets, cut costs, strengthened and expanded their product offerings, invested in their competitive moats, and as a result significantly increased their earnings power. Even after its strong performance in 2013, the U.S. stock market is still trading at a 6% to 7% earnings yield by our estimate and remains positioned for long-term growth based on underlying business fundamentals in our opinion. Within the context of today's extremely low interest rate and low inflation environment, stocks represent the most attractive major asset class in our view in both absolute and relative terms. Within the broader equity markets, select financial businesses continue to represent good value in our opinion based on their balance sheet strength, our expectations for their long-term earnings power and current valuations."
In Robert Olstein's The Olstein Strategic Opportunities Fund's 2014 Second Quarter Letter to Shareholders, he said:
"Although we expect the market for small- to mid-sized equities could be somewhat volatile in the near term as the Fed continues to taper its extraordinary monetary stimulus program, we also expect stronger economic data and improved company performance to highlight the strength of the U.S. economy. As in the past, we believe a key beneficiary of the improved economy will be smaller companies with strong financials and sustainable excess cash flow, whose revenues come mainly from domestic sources and whose stock is not being properly valued by the market according to our metrics. We believe the market volatility that has characterized the start of 2014 has provided an excellent opportunity to find viable investment opportunities in small- and mid-sized companies. In our search for value, we continue to focus on three crucial, company-specific factors: (1) a commitment to maintain a strong financial position as evidenced by a solid balance sheet; (2) an ability to generate sustainable free cash flow; and (3) management that intelligently deploys cash balances and free cash flow from operations to increase returns to shareholders."
In Robert Olstein's The Olstein All Cap Value Fund's 2014 Second Quarter Letter to Shareholders, he said:
"Despite a sharp contraction in the U.S. economy during the first quarter of the year, as well as rising global tensions due to armed conflict in Eastern Ukraine and in the Middle East, U.S. equity markets continued to chug along with the benchmark S&P 500 Index increasing 7.14% for the first six months of the year. With the strong market run now five years old, some forecasters are warning investors of an imminent pull back or decline. The ability to sell at market tops and buy at market bottoms is the dream of every portfolio manager, as the ability to perform this timing feat should produce meteoric investment returns. Rather than engaging in what we believe is an unachievable and long-term failure strategy of seeking to time when to be in or out of the overall market, our strategy is to pay the right price for stocks of financially strong companies selling at a discount to our calculations of intrinsic value, and to sell stocks when they reach our calculation of intrinsic value. While many investors are nervous about what they believe is an imminent correction in equity markets or remain sidelined waiting for accelerated economic growth, we are continuing to apply our discipline by investing in the equity securities of companies with stable or growing free cash flow, whose real economic value we believe is unrecognized by the market (obscured by market uncertainty or overshadowed by temporary problems). No methodology works all of the time but our objective is to be right over time."
In Meridian Funds's Meridian Growth Fund Second Quarter 2014 Commentary, it mentioned:
"As we look forward, we continue to find small and mid-cap growth companies that fit our criteria for large growing markets, defensible business models and excellent management teams. While we believe valuation multiples are still elevated, we do not believe they are at their peak. We will continue to focus on stocks that can perform well independent of the economy and we will use periods of volatility as a buying opportunity."
In John Hussman's Second Quarter 2014 Letter to Shareholders, he said:
"We believe that the financial markets are presently in the latter stages of what will ultimately be remembered as the "QE bubble" – a period of reckless speculation and overvaluation in a broad range of risky securities, particularly equities, high-yield debt, and leveraged loans (loans to already highly indebted borrowers). We view this bubble as the result of the Federal Reserve's policy of quantitative easing or "QE," which has driven short-term interest rates to zero, depriving investors of any source of safe return. This policy has encouraged investors to drive the prices of risky assets higher in a speculative "reach for yield," to the point that we presently estimate zero or negative total returns for the S&P 500 Index – from current price levels – on every horizon of eight years or less."
In Jeremy Grantham's GMO Second Quarter 2014 Letter, he mentioned:
"Accordingly, my recent forecast of a fully-fledged bubble, our definition of which requires at least 2250 on the S&P, remains in effect. What is worse for us value-driven bears, a further bullish argument has struck me recently concerning the probabilities of a large increase in financial deals. Don't tell me there are already a lot of deals. I am talking about a veritable explosion, to levels never seen before. These are my reasons. First, when compared to other deal frenzies, the real cost of debt this cycle is lower. Second, profit margins are, despite the first quarter, still at very high levels and are widely expected to stay there. Not a bad combination for a deal maker, but it is the third reason that influences my thinking most: the economy, despite its being in year six of an economic recovery, still looks in many ways like quite a young economy. The very disappointment in the rate of recovery thus becomes a virtue for deal making. Previous upswings in deals tended to occur at market peaks, like 2000 and 2007, which in complete contrast to today were old economic cycles already showing their wrinkles. I think it is likely (better than 50/50) that all previous deal records will be broken in the next year or two. This of course will help push the market up to true bubble levels, where it will once again become very dangerous indeed. My final thought on this issue is the following point, which I failed to make in my bubble discussion last quarter: perhaps the single best reason to suspect that a severe market decline is not imminent is the early-cycle look that the economy has. And even Edward Chancellor last quarter conceded that there was as yet no sign of a bubble in the quantity of credit that was being created."
As investors are happier with the higher balances in their account, they should never forget the word "RISK," which is directly linked to the valuations of the asset they own. A higher current valuation always implies a lower future returns.
According to our market valuation article at the beginning of 2014, Buffett Indicator and Shiller P/E Both Imply Long Term Negative Market Returns; 2014 Market Valuation, the good news is that our account balance is higher, investors are more bullish. The bad news is that we will see lower future returns.
GuruFocus hosts three pages about market valuations. The first is the market valuation based on the ratio of total market cap over GDP; the second is the measurement of the U.S. market valuation based on the Shiller P/E. These pages are for US market. We have also created a new page for international markets. You can check it out here. All pages are updated at least daily. Monthly data is displayed for the international market.
Why is this important?
As Warren Buffett pointed out, the percentage of total market cap relative to the U.S. GNP is "probably the best single measure of where valuations stand at any given moment."
Knowing the overall market valuation and the expected market returns will give investors a clearer head on where we stand for future market returns. When the overall market is expensive and positioned for poor returns, the overall market risk is high. It is important for investors to be aware of this and take consideration of this in their asset allocation and investing strategies.
Please keep in mind that the long-term valuations published here do not predict short-term market movement. But they have done a good job predicting the long-term market returns and risks.
Why did we develop these pages?
We developed these pages because of the lessons we learned over the years of value investing. From the market crashes in 2001-2002 and 2008-2009, we learned that value investors should also keep an eye on overall market valuation. Many times value investors tend to find cheaper stocks in any market. But a lot of times the stocks they found are just cheaper, instead of cheap. Keeping an eye on the overall market valuation will help us to focus on absolute value instead of relative value.
The indicators we develop focus on the long term. They will provide a more objective view on the market.
Ratio of Total Market Cap over GDP - Market Valuation and Implied Returns

The information about the market valuation and the implied return based on the ratio of the total market cap over GDP is updated daily. As of October 3, 2014, the total market cap as measured by Wilshire 5000 index is 120.5% of the U.S. GDP. We can see the equity values as the percentage of GDP are near their peaks. The only time they were higher was at the apex of the dot com bubble. The stock market is likely to return 1.3% a year from this level of valuation, including dividends in the coming years. The stock market is significantly overvalued. As a comparison, at the beginning of 2013, the ratio of total market cap over GDP was 97.5%, and it was likely to return 4% a year from that level of valuation.
A quick refresher (Thanks to Greenbacked): GDP is "the total market value of goods and services produced within the borders of a country." GNP is "is the total market value of goods and services produced by the residents of a country, even if they're living abroad. So if a U.S. resident earns money from an investment overseas, that value would be included in GNP (but not GDP)."
The following chart is the Ratio of Total Market Cap over GNP (As of September 30, 2014)

As of September 30, 2014, the ratio of Wilshire 5000 over GNP is 1.183.
For details, please go to the daily updated page. In general, the returns of investing in an individual stock or in the entire stock market are determined by these three factors:
1. Business growth
If we look at a particular business, the value of the business is determined by how much money this business can make. The growth in the value of the business comes from the growth of the earnings of the business growth. This growth in the business value is reflected as the price appreciation of the company stock if the market recognizes the value, which it does, eventually.
If we look at the overall economy, the growth in the value of the entire stock market comes from the growth of corporate earnings. As we discussed above, over the long term, corporate earnings grow as fast as the economy itself.
2. Dividends
Dividends are an important portion of the investment return. Dividends come from the cash earning of a business. Everything equal, a higher dividend payout ratio, in principle, should result in a lower growth rate. Therefore, if a company pays out dividends while still growing earnings, the dividend is an additional return for the shareholders besides the appreciation of the business value.
3. Change in the market valuation
Although the value of a business does not change overnight, its stock price often does. The market valuation is usually measured by the well-known ratios such as P/E, P/S, P/B etc. These ratios can be applied to individual businesses, as well as the overall market. The ratio Warren Buffett uses for market valuation, TMC/GNP, is equivalent to the P/S ratio of the economy.
Putting all the three factors together, the return of an investment can be estimated by the following formula:
Investment Return (%) = Dividend Yield (%)+ Business Growth (%)+ Change of Valuation (%)
From the contributions we can get the predicted return of the market.
The Predicted and the Actual Stock Market Returns
This model has done a decent job in predicting the future market returns. You can see the predicted return and the actual return in the chart below.

The prediction from this approach is never an exact number. The return can be as high as 6.2% a year or as low as -6.6% a year, depending where the future market valuation will be. In general, investors need to be cautious when the expected return is low.
Shiller P/E - Market Valuation and Implied Returns
The GuruFocus Shiller P/E page indicates that the Shiller P/E is 25.7. This is 54.8% higher than the historical mean of 16.6. Implied future annual return is 1.0%. The historical low for Shiller P/E is 4.8, while the historical high is 44.2.
The Shiller P/E chart is shown below:

Over the last decade, the Shiller P/E indicated that the best time to buy stocks was March 2009. However, the regular P/E was at its highest level ever. The Shiller P/E, similar to the ratio of the total market cap over GDP, has proven to be a better indication of market valuations.
Overall, the current market valuation is more expensive than the most of the last 130 years. It is cheaper than most of the time over the last 15 years.
To read more, please go to GuruFocus' Shiller P/E page.
Tobin's Q
The Q Ratio is a popular method of estimating the fair value of the stock market developed by Nobel Laureate James Tobin. He hypothesized that the combined market value of all the companies on the stock market should be about equal to their replacement costs.
The following graph is Tobin's Q for all U.S. corporations. The line shows the ratio of the U.S. stock market value to U.S. net assets at replacement cost since 1950.

The GuruFocus Economic Indicator Tobin Q page indicates that the Q ratio is 1.120 as of April 1, 2014. This is 57.3% higher than the historical mean of 0.71. Latest Q ratio is now the second highest in history, just following the peak of the Tech Bubble.
If Tobin's Q is greater than 1.0, then the market value is greater than the value of the company's recorded assets. This suggests that the market value reflects some unmeasured or unrecorded assets of the company. The market may be overvaluing the company.
S&P 500 Quarterly Buybacks
The GuruFocus Economic Indicator S&P 500 Quarterly Buybacks page indicates that the preliminary S&P 500 quarter buybacks is $116.17 billion as of June 30, 2014. According to S&P Dow Jones Indices press release, "the preliminary results show that S&P 500 stock buybacks, or share repurchases, decreased 1.6% to $116.2 billion during the second quarter of 2014, down from the $118.1 billion spent on share repurchases during the second quarter of 2013. The $116.2 billion also represents a 27.1% decline over the $159.3 billion spent on stock buybacks during Q1 2014, which was the second largest on record." The slowdown in buybacks is a negative sign for the U.S. stock market. Share repurchases are the main way companies reduce the float of shares. Perhaps fewer companies like what they see when they look into the future.
The following chart is the S&P 500 quarterly buybacks since 2000.

John Hussman's Peak P/E:
John Hussman currently estimates prospective 10-year nominal total returns about 1.5% annually, with zero or negative expected total returns on every horizon shorter than eight years.
In John Hussman's commentary on September 15, 2014, "A Warning from Graham and Dodd" he said "While investors presently dismiss the potential for valuations to remain well-correlated with actual subsequent market returns, and there's no assurance that they will, the foregoing rule-of-thumb has historically had a nearly 90% correlation with S&P 500 nominal total returns over the following decade. The chart of this relationship (from the April 21 comment) is shown below. Note that secular valuation lows as we saw in 1949 and 1982 have generally occurred at levels that have implied near-20% annual 10-year total returns for the S&P 500. The 2009 low was certainly a great improvement from the 2000 extreme, bringing prospective 10-year returns to about 10% annually (and slightly higher on
 The FTC says AT&T reduced speeds for customers with unlimited data plans by nearly 90% in some cases. NEW YORK (CNNMoney) AT&T is back in the government's crosshairs.
  Health insurance: 5 basic questions to ask NEW YORK (CNNMoney) Got health insurance at work? You may still have to shell out thousands of dollars before it kicks in.
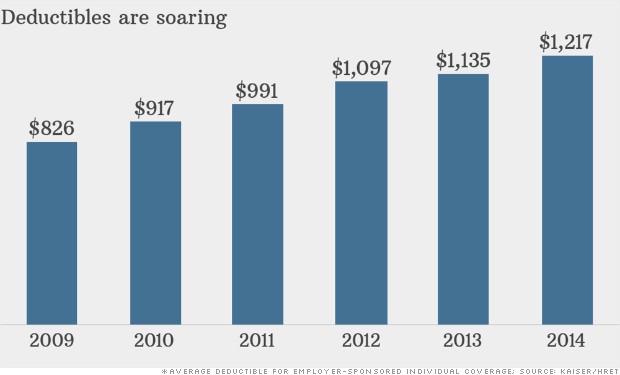
 Medical care has become more costly for the Vance family under a high-deductible plan.


 Getty Images Ever since I was a kid, I've been obsessed with saving money. I've also been partially obsessed with the fear that I won't have enough money in retirement to live comfortably, and will wind up eating dog food or living in a halfway house when I'm old. Maybe those ideas are extreme, but the fear that I won't have enough saved for retirement has certainly gotten me to contribute regularly to my 401(k), though that's something I wish I'd started a lot earlier and saved more robustly during my working life. Maybe it was the convalescent hospitals I visited one summer to help my mom while she worked that made me a determined saver. After setting up an activity for the residents, I could walk around the convalescent home for a bit, seeing how frail and forgotten some of them were. They had the money to stay there, but it was a place I never wanted to live. However my fear of not having enough money to live comfortably in old age came about, I only really started saving for retirement at about my third job out of college. That was when pensions were being eliminated by employers, and self-directed 401(k)s were being introduced as retirement savings vehicles. I remember the financial services company representative giving us workers -- many of whom, like me, could barely afford an apartment in the bad part of town -- a speech about how we were now responsible for our retirement, and our employer would match the contributions we made. To me, that sounded like an automatic raise -- which was rare at this company -- though it was a raise I wouldn't see until I retired. Powerful and Relatively Painless Through automatic withdrawals from my paycheck, I saw the power of saving regularly and how my money compounded over time. It was an easy and relatively painless way to save because I didn't really notice the money going to my 401(k) because the money wasn't going into my checking account. You can't spend what you don't see. It also helped reinforce an earlier lesson in how automatic withdrawals can be a painless way to save money for long-term goals. I now contribute to a SEP IRA as a self-employed freelance writer, though not through automatic withdrawals, because my monthly income fluctuates. Instead, I set aside money from one client each month to put into the individual retirement account, and I send a check to my brokerage firm. There are months when I'm not as good as I should be about sending that check -- usually ones when I don't earn much from that client -- so I try to contribute the money I earn from any extra work to my retirement savings, too. I don't know if I'll ever stop worrying completely about having enough money saved for retirement, but I'm glad that I realized early how important it is. More from Aaron Crowe
 Abbas Dulleh/APHealth workers in Liberia wait to carry the body of a suspected Ebola victim. The Ebola virus outbreak in West Africa has been brutal. There have been 8,400 cases, according to the Centers for Disease Control and Prevention, and 4,033 confirmed deaths, and the outlook is only getting more grim, according to the World Health Organization. But the scary statistics could mean a windfall for some foresightful investors who figured that someday, we'd all be worried about this deadly plague. Nevada-based Blue String Ventures bought the domain name ebola.com in 2008 and hopes to sell it now for $150,000, according to CNBC. "We've had many inquiries on the domain over the years," Jon Schultz, president of Blue String Ventures, said. Blue String Ventures buys domain names that it thinks will eventually grow in value when companies or organizations suddenly want to be associated with an idea or topic. The firm owns domain names like Fukushima.com, referring to the nuclear plant meltdown in Japan, as well as health- or dietary supplement-related ones, including GreenCoffeeExtract.com and BirdFlu.com For now, the page ebola.com includes various links. One is to an ebook claiming that nutritional supplements might help cure the disease; another is to a site that sells that supplement. Commercial Interest Said to Be Unlikely "Having seen the movie 'Outbreak,' I was entranced by the subject and couldn't resist buying the domain," Schultz told CNBC. Large pharmaceutical firms and smaller biotech startups working on treatments or cures for Ebola have reportedly been approached about buying the site, but so far there have apparently been no takers. That isn't surprising. Pharmaceutical companies generally focus on diseases with a much larger rate of incidence or where the patients have health insurance or enough personal wealth to pay well for help. Ebola requires government subsidies to combat it, and it likely won't generate commercial interest otherwise. In case you're interested, ebolacure.com is also taken, although it's owned by a company that uses a service to keep its actual name out of official Web records. More from Erik Sherman
 REUTERS