 Daniel Acker/Bloomberg via Getty ImagesA 2011 Suzuki Kizashi Sport on display at the New York International Auto Show in 2010. DETROIT -- Spiders drawn to gasoline vapors and weaving webs that block a hose to vent those vapors have caused Suzuki Motor of America to recall about 19,000 Kizashi midsize sedans from model years 2010 to 2013, U.S. regulators said Wednesday. Air flow blocked in the cars' evaporative emissions system can cause negative pressure in the fuel tank, which can lead to cracks which could cause leaks that increase risk of a fire, said the National Highway Traffic Safety Administration. This is a similar problem to one experienced by some Mazda6 owners. Mazda Motor has recalled the Mazda6 twice since 2011 because of spiders building webs in ventilation hoses. No crashes or injuries have been reported in relation to this issue, Suzuki told NHTSA. Suzuki last year stopped selling cars in the U.S. market after nearly three decades, so NHTSA and Suzuki advise Kizashi owners to take their sedans to authorized "service providers." Letters the company will send to car owners and filed with NHTSA don't identify where these service providers are, but owners can call a customer service line at 800-934-0934 to find out. The remedy to be applied is a filter on a ventilation line to keep the spiders out. The Kizashi was one of the company's best-sellers in the United States before Suzuki in late 2012 said it would stop selling vehicles in the U.S. market after its standing inventory ran out. U.S. Kizashi sales reached about 7,000 in 2011 and fell each year after that. When you get into that back office and start signing all the paperwork, the topic of extended warranties will come up pretty quickly. Ellie Kay, an author of 15 finance-related books, notes that such warranties are negotiable. "Before you sign on the dotted line, check out other sources of extended warranty pricing," she says, such as those provided by your bank or insurance company. "Then either use this lower price in the financial and insurance office for negotiation to get them to match the price, or buy it from the other source." A scenario from Kay during her last car purchase: "The dealer quoted me $4,200 for a three-year extended warranty for my 280SLK Roadster Mercedes that included a $250 deductible. USAA -- my insurance company -- gave me a three-year warranty for $3,200 with zero deductible. I've used the new warranty once already. The bill was $1,100 and I paid nothing because of the zero deductible." Bottom line: The default extended warranty is almost always the worst deal. 1. You'll get the dealer's extended warranty You may have a monthly payment figure in your head when shopping for a new car, but your interests are better served when you focus on the out-the-door price instead. "A sales rep can often trick you by offering a lower monthly payment, but [one that] will stretch out the terms of the loan," says David Bakke, a car buying expert at MoneyCrashers.com. You can reduce the overall cost of the car via negotiation and by skipping accessories and add-ons. "Things like navigation systems, rims, floor mats or car audio/entertainment systems can be purchased from a third party vendor, usually for less."
Thursday, August 28, 2014
Spider Webs Force Recall of Suzuki Kizashi Sedans
Monday, August 25, 2014
Benzinga Weekly Preview: Putin And Poroshenko Set To Discuss A Peace Plan
 Related BBY Yellen's Speech Not Enough To Keep Dow, S&P 500 In Positive Territory GameStop Up As Q2 Earnings Surpass Estimates on Higher Sales When Rate Hikes Come, They Will Ripple Across U.S. Economy (Fox Business) Related DG Yellen's Speech Not Enough To Keep Dow, S&P 500 In Positive Territory FBR Says Dollar Tree To Meet Or Beat Dollar General On Family Dollar Family Dollar Rejects Dollar General Proposal (Fox Business)
 Ukraine will be in the spotlight next week as Russian President Vladimir Putin finally meets with his Ukrainian counterpart, Petro Poroshenko.
German Chancellor Angela Merkel will also travel to Ukraine to help find a lasting solution to end the nation’s ongoing crisis. With Russia and the West caught up in a sanctions war over the situation in Ukraine, the talks are an important milestone in Ukraine’s crisis.
Key Earnings ReportsNext week investors will be waiting for several key earnings reports including Best Buy (NYSE: BBY), Dollar General (NYSE: DG), Abercrombie & Fitch (NYSE: ANF) and Tiffany & Co (NYSE: TIF).
Best BuyBest Buy is expected to report second quarter EPS of $0.32 on revenue of $9.01 billion, compared to last year’s EPS of $0.32 on revenue of $9.30 billion.
On August 16, S&P Capital IQ gave Best Buy a Hold rating with a $25.00 price target. The analyst team at S&P sees mixed results as the company attempts to compete with its online counterparts.
“We see BBY taking action to improve service and reduce costs in an attempt to compete profitably with Internet retailers as the consumer electronics category migrates online. We expect mixed results in light of an intensely competitive environment, and we think necessary price investments and ongoing deflation in certain categories will limit the beneficial impact of effective cost management.”
On June 11, Credit Suisse gave Best Buy an Outperform rating with a $40.00 price target. The analysts at Credit Suisse see the company thriving due to its inventive business strategy.
“One of the concerns about brick and mortar retailing is that store rent, an essentially fixed cost in the near term, is similar to a ball and chain around a retailer's neck, a cost that becomes heavier as traffic and productivity decline. Yet one retailer, Best Buy, has figured out how to turn this into an advantage by renting out the space to its primary suppliers, not only reducing rent and employee costs, but creating a better shopping experience for customers. Yesterday at Best Buy's annual meeting, Hubert Joly commented on the success of the store-within-a-store and strongly indicated that we will see more of this. We view this as one of the more insightful changes this superb management team has instituted at BBY.”
On August 14, Merrill Lynch gave Best Buy a Buy rating with a $36.00 price objective, noting that upcoming product cycles will likely benefit the company in the near term.
“We forecast 2Q EPS of $0.28 versus $0.32 last year and consensus of $0.32. Our estimate could be conservative and we note that continued outperformance in expense reduction could offset soft comps. While 2Q and 3Q will likely be impacted by a relative lack of new products coming to market, industry trends should fare much better in 4Q and into 2015. In particular, we expect a TV cycle driven by 4K sets (which boast 4x the resolution of HD TVs). BBY stands to benefit from meaningful product cycles in TV’s, gaming and appliances.”
Dollar General CorporationDollar General is expected to report second quarter EPS of $0.83 on revenue of $4.77 billion, compared to last year’s EPS of $0.77 on revenue of $4.39 billion.
On August 21, S&P Capital IQ gave Dollar General a Sell rating with a $59.00 target price, noting that the company’s customer base has remained conservative about spending.
“We believe DG will face more intense competition in FY 15 after its closest peer Family Dollar (FDO 66, Sell) reported negative comparable store sales growth during the holiday and winter seasons and a negative outlook for the fiscal year. Additionally, we believe the company's core low-income customer remains under intense economic pressure due to a weak job growth market and following cuts to Supplemental Nutrition Assistance Program benefits.”
On August 18, Credit Suisse upgraded its rating for Dollar General from Neutral to Outperform with a $74.00 price target shortly following the company’s bid to buy Family Dollar.
“We are upgrading DG to Outperform from Neutral and raising our target price to $74 from $59 to reflect the company's announced bid for FDO. While not yet accepted by FDO and the eventual purchase price could be higher if DLTR counters, we believe there is a strong likelihood of DG eventually winning the asset now that their interest has been confirmed and see the combination creating significant value for shareholders. DG clearly has the ability to pay much more than DLTR, as we estimate synergies could approach $1 billion in cost and revenue benefits and see accretion at $1-2 per share. We also believe this combination makes much better strategic sense than a DLTR/FDO deal and it would clearly provide the next leg to what has already been one of the most attractive investments in retail.”
On August 18, Merrill Lynch gave Dollar General a Buy rating with a $73.00 price objective, taking into consideration the company’s proposal to acquire Family Dollar.
“Dollar General announced today a proposal to acquire Family Dollar for $78.50 per share in cash, in a transaction valued at $9.7bn on an EBITDA multiple of 11.6x. The offer is greater than the $74.50 offer by DLTR announced on July 28th, 2014and would be an all cash deal vs. DLTR’s cash/stock offer. DG stated it has already secured committed financing of $12.3bn including a revolver, term loan, and notes. The financing would also include the $305mn termination fee payable to DLTR. DG’s adjusted debt to EBITDAR would be 5.5x and the company believes it could return to investment grade within 3 years. The company estimates that the proposed transaction would be low DD accretive to earnings in the first year.”
Abercrombie & Fitch CompanyAbercrombie & Fitch is expected to report second quarter EPS of $0.11 on revenue of $909.22 million, compared to last year’s EPS of $0.14 on revenue of $945.70 million.
On August 16, S&P Capital IQ gave Abercrombie & Fitch a Hold rating with a $42.00 price target, noting that the company’s shares are currently quite fairly valued.
“We view the shares as fairly valued at recent levels, as ANF navigates a transition period amid intensifying competition in the U.S. from fast-fashion retailers such as Forever 21 and H&M. We think it is particularly crucial for the company to improve the fashion of its female business. While we think ANF needs to invest more in differentiated fashions and store remodels to regain a competitive edge, we look for expense cuts and ongoing rationalization of ANF's U.S. store base to support higher sales productivity and margin recovery in FY 2015. Also, we are encouraged by a continued strong growth trajectory for the DTC business.”
On July 31, Merrill Lynch gave Abercrombie & Fitch a Neutral rating, noting that the company’s clothing has finally caught up with current fashion trends.
“Abercrombie has been slow to react to fashion changes in the women’s department and we view the new Fall assortment as the biggest change that we have seen at the brand in years. The addition of the color black, a more feminine aesthetic and a lack of logo were the biggest changes. The new fashion was priced higher than fast fashion competition, but we expect it to be put on promotion at strategic times. Still, we think the new look will attract some interest.”
Tiffany & CoTiffany & Co is expected to report second quarter EPS of $0.85 on revenue of $987.86 million, compared to last year’s EPS of $0.83 on revenue of $925.88 million.
On August 16, S&P capital IQ gave Tiffany & Co a Hold rating with a $100.00 target price, noting that the company’s shares are currently fairly valued.
“We view the shares as reasonably valued at recent levels. In the quarter ended April 30, 2014, worldwide same-store sales (on a constant currency basis) increased 11%. By region, same-store sales rose 8% in the Americas, 30% in Japan, 18% in the U.A.E., and 10% in Asia-Pacific, but were down 35 in Europe. Through retail, product and marketing investments, we see TIF successfully growing its global high end customer base, which is supporting strong sales of statement, fine and solitaire jewelry (i.e., higher priced jewelry with diamonds and/ or other gemstones).We also believe the company is attracting new customers through its lower priced fashion jewelry assortment.”
On August 13, Credit Suisse gave Tiffany & Co an Outperform rating with a $104.00 price target, pointing out the company could face some headwinds from Asia.
“We are concerned about broad-based evidence of slowing demand trends in APAC, particularly soft Macau casino revenue, weak Hong Kong watch and jewelry sales, tepid Swiss watch exports, and softness in fine wine and liquor sales. Perhaps the clearest indicator lies in watch and jewelry sales in Hong Kong, where April/May/June 2014 sales are down an average of 30% Y/Y. Some of this decline is due to lapping of heavy gold buying on favorable pricing last year, but we see potential for spillover into high-end jewelry and watch purchasing. Swiss watch exports also remain weak, with 2Q sales up a modest 1.4% (up 2% in Hong Kong) versus 4.1% growth in 1Q (7% Hong Kong).”
On July 2, Merrill Lunch gave Tiffany & Co a Buy rating with a $115 price objective, saying that improving consumer spending in the U.S. could have positive effects on the company.
“Our Price Objective for Tiffany of $115 is based on a P/E multiple of 24x our F2015 EPS estimate. This represents a premium to the luxury peer group average of 19x. We think a premium is justified given reaccelerating US trends, an immature business in key regions where other luxury companies are struggling to grow, and the outsized growth potential of watches and fashion jewelry versus peers. Risks to our PO: further deceleration in Asian and European comps, Yen headwinds, commodity cost increases, deteriorating health of the global luxury consumer.”
Economic ReleasesNext week will be a busy week for economic releases with the U.S. set to put out several important reports. Housing data is expected to show a rebound in new home sales, but home prices likely increased more slowly.
Daily ScheduleMonday
Earnings Releases Expected: CNinsure (NASDAQ: CISG), Adept Technology (NASDAQ: ADEP), OSI Systems (NASDAQ: OSIS) Economic Releases Expected: U.S. new home sales, U.S. services PMI, German Ifo business climate indexTuesday
Earnings Expected: Bob Evans Farms (NASDAQ: BOBE), Analog Devices (NASDAQ: ADI), TiVo (NASDAQ: TIVO), Best Buy (NYSE: BBY), DSW (NYSE: DSW) Sanderson Farms (NASDAQ: SAFM) Economic Releases Expected: U.S. consumer confidence, U.S. house price index, U.S. Redbook, U.S. durable goods ordersWednesday
Earnings Expected: The Wet Seal (NASDAQ: WTSL), Express (NYSE: EXPR), Tiffany & Co (NYSE: TIF) Economic Releases Expected: U.S. oil inventory data, German consumer climate, Italian consumer confidenceThursday
Earnings Expected From: Abercrombie & Fitch (NYSE: ANF), Dollar General (NYSE: DG), Genesco (NYSE: GCO), Constellium NV (NYSE: CSTM) Economic Releases Expected: Japanese retail sales, Japanese industrial production, Japanese unemployment rate, British consumer confidence, U.S. GDP, eurozone consumer confidence, German unemployment rate, Spanish GDPFriday
Earnings Expected From: Noodles & Co. (NASDAQ: NDLS) Economic Releases Expected: U.S. Consumer Sentiment, Canadian GDP, Italian GDP, Italian CPI, eurozone unemployment rate, eurozone CPI, German retail sales, Spanish retail sales, Japanese housing startsPosted-In: Earnings News Guidance Previews Economics Pre-Market Outlook Markets
Monday, August 18, 2014
Michael Kors ‘Undeservedly Punished,’ Morgan Stanley Says
After dropping 11% in the past month, is it time to buy Michael Kors (KORS)? Morgan Stanley’s Kimberly Greenberger and Amber Turley think it is:

Concerns of increased promotions left investors wondering if KORS’ US demand stalled, driving the stock down 7.5% since 7/14. We think the brand remains resilient and see upside into 1Q. At 18x CY15 EPSe given 19% 3 yr EPSe CAGR, we think the market undeservedly punished KORS…
KORS is a MS Best Idea and we think it deserves to trade at a premium to Coach (COH): KORS’ valuation would have you believe it is Coach’s sister stock. However, while both trade at 18xFY2 EPSe, the similarities end there. We do not expect Coach to achieve earnings growth until at least 2017,assuming the company’s significant investments can turn its tarnished brand perception. On the other hand, we expect KORS to deliver 19% 3 yr EPS CAGR helped by category diversity/expansion and accelerating international growth by leveraging its strong brand position.
Shares of Michael Kors have gained 1.4% to $82.21 at $3:18 p.m., while Coach has risen 0.3% to $34.35.
Oracle Continues to Be One the Most Profitable Business-Software Company
In this article, let´s see one of the most important financial ratios applying to stockholders, the best measure of performance for a firm's management: the Return on Equity (ROE), and we are going to analyze it in the case of Oracle Corporation (ORCL), the leading provider of enterprise technology solutions, offering software, services and hardware.ROE is calculated as net income applicable to common shares divided by the average book value of common equity: ROE = Net Income / Av. Book ValueA higher ROE is viewed as a positive aspect for the company, but the reason behind it should be examine. From the equation above, we can see that if book value is decreasing more rapidly than net income, the ratio will increase, but this is not good for the firm.Dupont AnalysisThis approach can be used to analyze the ROE. With some algebra we can break down ROE into a function of different ratios. Firstly, we are going to consider the original approach:Original Dupont Equation: Three-Part DupontTaking the ROE equation: ROE = net income / shareholder's equity and multiplying ROE by (revenue / revenue), and rearranging terms we get:ROE = (net income / revenue) * (revenue / shareholder's equity)We now have ROE broken into two parts, the first is net profit margin, and the second is the equity turnover ratio. Now we can expand this by multiplying these terms by (assets / assets), and rearranging we end up with the three-step DuPont equation.ROE = (Net Income / Revenue) * (Revenue / Assets) * (Assets / Shareholder's Equity)This equation for ROE breaks it into three widely used and studied components:ROE = (Net profit margin)* (Asset Turnover) * (Leverage ratio)The first term is what we called previously net profit margin, the second term is asset turnover and the third tem is a financial leverage ratio. If we have a low ROE, one of the following must be true:The firm has a poor profit marginThe firm has a poor asset turnoverThe firm has a little leverage
| ROE (%! ) 3 Step | May-05 | May-06 | May-07 | May-08 | May-09 | May-10 | May-11 | May-12 | May-13 | May-14 |
| Net Profit Margin | 24.46 | 23.51 | 23.75 | 24.61 | 24.05 | 22.87 | 23.99 | 26.89 | 29.38 | 28.62 |
| Asset Turnover | 0.57 | 0.5 | 0.52 | 0.48 | 0.49 | 0.44 | 0.48 | 0.47 | 0.45 | 0.42 |
| Leverage | 1.92 | 1.92 | 2.04 | 2.04 | 1.89 | 2.00 | 1.85 | 1.79 | 1.82 | 1.92 |
| ROE | 26.63 | 22.52 | 25.26 | 23.98 | 22.29 | 19.92 | 21.49 | 22.85 | 24.47 | 23.37 |
 As we can appreciate, the ROE has increased and it can be attributed to the rise in profitability as measured by the Net Profit Margin and the decline in financial leverage, which I think it is a very good thing and based on it I would recommend this stock. Further, the ROE of Oracle is ranked higher than 95% of the 1548 Companies in the Software - Infrastructure industry.Hedge fund gurus have also been active in the company. Gurus like Louis Moore Bacon (Trades, Portfolio), Steven Cohen (Trades, Portfolio) and James Barrow (Trades, Portfolio) have bought the stock in the first quarter of 2014.Disclosure: Omar Venerio holds no position in any stocks mentioned.Also check out: James Barrow Undervalued Stocks James Barrow Top Growth Companies James Barrow High Yield stocks, and Stocks that James Barrow keeps buying Louis Moore Bacon Undervalued Stocks Louis Moore Bacon Top Growth Companies Louis Moore Bacon High Yield stocks, and Stocks that Louis Moore Bacon keeps buying
 | Currently 3.00/512345 Rating: 3.0/5 (2 votes) | Voters: |
More GuruFocus Links
| Latest Guru Picks | Value Strategies |
| Warren Buffett Portfolio | Ben Graham Net-Net |
| Real Time Picks | Buffett-Munger Screener |
| Aggregated Portfolio | Undervalued Predictable |
| ETFs, Options | Low P/S Companies |
| Insider Trends | 10-Year Financials |
| 52-Week Lows | Interactive Charts |
| Model Portfolios | DCF Calculator |
RSS Feed  | Monthly Newsletters |
| The All-In-One Screener | Portfolio Tracking Tool |
 MORE GURUFOCUS LINKS
 | Latest Guru Picks | Value Strategies |
| Warren Buffett Portfolio | Ben Graham Net-Net |
| Real Time Picks | Buffett-Munger Screener |
| Aggregated Portfolio | Undervalued Predictable |
| ETFs, Options | Low P/S Companies |
| Insider Trends | 10-Year Financials |
| 52-Week Lows | Interactive Charts |
| Model Portfolios | DCF Calculator |
| RSS Feed | Monthly Newsletters |
| The All-In-One Screener | Portfolio Tracking Tool |
 40.02 (1y: +26%) $(function(){var seriesOptions=[],yAxisOptions=[],name='ORCL',display='';Highcharts.setOptions({global:{useUTC:true}});var d=new Date();$current_day=d.getDay();if($current_day==5||$current_day==0||$current_day==6){day=4;}else{day=7;} seriesOptions[0]={id:name,animation:false,color:'#4572A7',lineWidth:1,name:name.toUpperCase()+' stock price',threshold:null,data:[[1374469200000,31.87],[1374555600000,32.07],[1374642000000,32.39],[1374728400000,32.37],[1374814800000,32.54],[1375074000000,32.48],[1375160400000,32.55],[1375246800000,32.35],[1375333200000,32.75],[1375419600000,32.57],[1375678800000,32.78],[1375765200000,33],[1375851600000,32.82],[1375938000000,33.02],[1376024400000,32.92],[1376283600000,33.25],[1376370000000,33.25],[1376456400000,33.57],[1376542800000,32.73],[1376629200000,32.41],[1376888400000,32.06],[1376974800000,32.2],[1377061200000,32.3],[1377147600000,32.4],[1377234000000,31.77],[1377493200000,32.34],[1377579600000,31.78],[1377666000000,31.66],[1377752400000,31.7],[1377838800000,31.86],[1378184400000,32.02],[1378270800000,32.32],[1378357200000,32.26],[1378443600000,32.2],[1378702800000,32.75],[1378789200000,32.86],[1378875600000,33.02],[1378962000000,32.79],[1379048400000,32.46],[1379307600000,32.97],[1379394000000,33.26],[1379480400000,33.87],[1379566800000,33.89],[1379653200000,34.05],[1379912400000,33.94],[1379998800000,33.64],[1380085200000,33.87],[1380171600000,33.81],[1380258000000,33.78],[1380517200000,33.17],[1380603600000,33.5],[1380690000000,33.68],[1380776400000,33.24],[1380862800000,33.21],[1381122000000,32.84],[1381208400000,32.37],[1381294800000,32.19],[1381381200000,32.99],[1381467600000,33.26],[1381726800000,33.28],[1381813200000,32.75],[1381899600000,33.02],[1381986000000,32.87],[1382072400000,32.9],[1382331600000,32.95],[1382418000000,32.9],[1382504400000,32.7],[1382590800000,33.07],[1382677200000,33.15],[1382936400000,33.14],[1383022800000,33.71],[1383109200000,33.53],[1383195600000,33.5],[1383282000000,33.53],[1383544800000,33.71],[1383631200000,33.5],[1383717600000,34.07],[1383804000000,34],[1383890400000,34.35],[1384149600000,34.37],[1384236000000,34.7],[1384322400000,35],[1384408800000,34.38],[1384495200000,34.92],[1384754400000,34.93],[1384840800000,34.76],[1384927200000,34.75],[1385013600000,3! 4.94],[1385100000000,34.83],[1385359200000,34.78],[1385445600000,34.93],[1385532000000,35.29],[1385704800000,35.29],[1385964000000,35.08],[1386050400000,35.07],[1386136800000,35.07],[1386223200000,34.85],[1386309600000,35.48],[1386568800000,35.6],[1386655200000,34.8],[1386741600000,34.56],[1386828000000,33.6],[1386914400000,33.23],[1387173600000,33.54],[1387260000000,33.63],[1387346400000,34.6],[1387432800000,36.6],[1387519200000,36.37],[1387778400000,36.93],[1387864800000,37.32],[1388037600000,37.69],[1388124000000,37.98],[1388383200000,37.99],[1388469600000,38.26],[1388642400000,37.84],[1388728800000,37.62],[1388988000000,37.47],[1389074400000,37.85],[1389160800000,37.72],[1389247200000,37.65],[1389333600000,38.11],[1389592800000,37.75],[1389679200000,38.21],[1389765600000,38.41],[1389852000000,38.29],[1389938400000,38.21],[1390284000000,38.11],[1390370400000,37.98],[1390456800000,38.15],[1390543200000,37.11],[1390802400000,36.49],[1390888800000,37.1],[1390975200000,36.97],[1391061600000,37.4],[1391148000000,36.9],[1391407200000,35.84],[1391493600000,35.96],[1391580000000,35.95],[1391666400000,36.72],[1391752800000,37.19],[1392012000000,37.3],[1392098400000,37.84],[1392184800000,38.07],[1392271200000,38.42],[1392357600000,37.98],[1392703200000,37.97],[1392789600000,37.87],[1392876000000,38.27],[1392962400000,38.1],[1393221600000,38.14],[1393308000000,38.25],[1393394400000,38.5],[1393480800000,38.95],[1393567200000,39.11],[1393826400000,38.51],[1393912800000,39.41],[1393999200000,39.5],[1394085600000,39.46],[1394172000000,38.83],[1394427600000,38.86],[1394514000000,38.9],[1394600400000,38.52],[1394686800000,37.65],[1394773200000,37.6],[1395032
Sunday, August 17, 2014
The 5 States With the Highest Sales Tax

Oklahoma is among the states that levy exceptionally high sales taxes. Source: Boston Public Library via Flickr.
Nearly every state in the union charges a sales tax, and the tax levied on goods and services sold at the retail level is just one of many tools states use to collect revenue, along with licensing and taxes on income, corporations, and property. Sales taxes tend to attract less attention than income taxes, though general sales taxes and gross receipts taxes, which are charged to businesses for transactions, contribute nearly as much revenue as state income taxes. In 2013, states collected $254.7 billion in sales and gross receipts taxes -- about $806 per American -- versus $980 per person in state income taxes.
The median sales and local tax in the U.S. is just under 7%. Here's a look at the five states with the highest combined state and local sales taxes:
No. 1: Tennessee, 9.45%
Tennessee charges a statewide rate of 7%, putting it in second place alongside Indiana, Mississippi, New Jersey, and Rhode Island. Local taxes help tip the scales to almost 10%, as municipalities are allowed to add on as much as 2.75%. However, Tennesseans benefit from having no earned income tax, and they have the sixth-lowest overall state and local tax burden in the country, according to the nonprofit Tax Foundation.
No. 2: Arkansas, 9.19%
Arkansas, Tennessee's neighbor to the west, ranks No. 2 with a combined state and local sales tax rate averaging just over 9%. Arkansas lifted its sales tax rate from 6% to 6.5% last year, making its composition of state and local taxes similar to Tennessee's. However, Arkansans pay more in taxes overall, with their state and local tax burden averaging 10.3% to rank 12th-highest in the country.
No. 3: Louisiana, 8.89%
Louisiana, another Southern state, charges an average sales tax near 9% on goods and services. Unlike Tennessee and Arkansas, Louisiana has a relatively low statewide sales tax rate of 4%, but it allows municipalities to charge as much as 7%. Therefore the state has the highest average local sales tax rate in the nation, at 4.89%. However, Louisianans nevertheless have the fifth-lowest overall tax burden in the nation, thanks in part to relatively low income taxes.
No. 4: Washington, 8.88%
Washington state charges no income tax or corporate income tax, so it relies heavily on the sales tax to fund its budget. The 6.5% statewide rate is one of the highest in the nation. Washingtonians' average state and local tax burden is just below the national median at 9.4%. However, the state's tax structure was ranked as the most regressive by the Institute on Taxation and Economic Policy, which said that the poorest 20% of Washingtonians pay an average of 16.9% of their income in state taxes, compared to a rate of just 2.8% for the top 1%.
No. 5: Oklahoma, 8.72%
With a statewide sales tax rate of 4.5%, the Sooner state is one of the most reliant on local taxes: While residents pay 4.22% on average in local sales taxes, the state allows a maximum local sales tax of 6.5%, which makes for sales taxes as high as 11%. Still, Oklahomans have a relatively low tax burden, paying 8.47% of income in state and local taxes compared to a nationwide average of 9.8%.
Taxes and sales
Considering the average state has a sales tax near 7%, a couple of percentage points extra for the states above may seem negligible, but sales taxes do play a role in consumer decision making. Differences in local sales taxes can draw shoppers from one community to another, especially when the difference is significant. Salem County, N.J., for example, is exempt from New Jersey's 7% sales tax because it borders Delaware, which charges no sales tax. Though some states -- including Virginia, Maine, Ohio, and Arkansas -- have recently raised sales tax rates, revenue from sales taxes should improve alongside the economy.
Last year, the total amount collected from sales taxes nationwide rose 3.9%, while state income tax collection rose 10.3%; this shows that income is more sensitive to economic conditions than spending and demonstrates one reason why sales taxes are considered regressive.
Take advantage of this little-known tax "loophole"
Recent tax increases have affected nearly every American taxpayer. But with the right planning, you can take steps to take control of your taxes and potentially even lower your tax bill. In our brand-new special report "The IRS Is Daring You to Make This Investment Now!," you'll learn about the simple strategy to take advantage of a little-known IRS rule. Don't miss out on advice that could help you cut taxes for decades to come. Click here to learn more.
Saturday, August 16, 2014
4 Big-Volume Stocks Triggering Breakout Trades
DELAFIELD, Wis. (Stockpickr) -- Professional traders running mutual funds and hedge funds don't just look at a stock's price moves; they also track big changes in volume activity. Often when above-average volume moves into an equity, it precedes a large spike in volatility.
Read More: Triple Your Gains With These 5 Cash-Rich Companies
Major moves in volume can signal unusual activity, such as insider buying or selling -- or buying or selling by "superinvestors."
Unusual volume can also be a major signal that hedge funds and momentum traders are piling into a stock ahead of a catalyst. These types of traders like to get in well before a large spike, so it's always a smart move to monitor unusual volume. That said, remember to combine trend and price action with unusual volume. Put them all together to help you decipher the next big trend for any stock.
Read More: 5 Stocks Set to Soar on Bullish Earnings
With that in mind, let's take a look at several stocks rising on unusual volume recently.
Inogen
Inogen (INGN), a medical technology company, develops, manufactures and markets portable oxygen concentrators. This stock closed up 4.5% at $19.03 in Wednesday's trading session.
Wednesday's Volume: 630,000
Three-Month Average Volume: 56,388
Volume % Change: 913%
From a technical perspective, INGN gapped up sharply higher here right above some near-term support at $18 with monster upside volume flows. This strong spike to the upside on Wednesday briefly pushed shares of INGN back above its 50-day moving average of $19.40, before the stock closed just below that level at $19.03. Shares of INGN are now starting to trend within range of triggering a near-term breakout trade. That trade will hit if INGN manages to take out Wednesday's intraday high of $19.60 to some more near-term overhead resistance at $20 with high volume.
Traders should now look for long-biased trades in INGN as long as it's trending above Wednesday's intraday low of $18.52 and then once it sustains a move or close above those breakout levels with volume that's near or above 56,388 shares. If that breakout triggers soon, then INGN will set up to re-test or possibly take out its next major overhead resistance levels at $21 to $22.37, or even $23 to its 52-week high at $24.37.
Read More: 5 Stocks With Big Insider Trading
Paycom Software
Paycom Software (PAYC), provides a cloud-based human capital management software solution delivered as software-as-a-service in the U.S. This stock closed up 6.1% at $14.75 in Wednesday's trading session.
Wednesday's Volume: 378,000
Three-Month Average Volume: 97,622
Volume % Change: 198%
From a technical perspective, PAYC ripped sharply higher here right above its 50-day moving average of $13.70 and into breakout territory above some near-term overhead resistance at $14.08 with strong upside volume flows. This large move to the upside on Wednesday is now quickly pushing shares of PAYC within range of triggering another big breakout trade. That trade will hit if PAYC manages to take out Wednesday's intraday high of $14.78 to some more near-term overhead resistance levels at $15.22 to $15.61 with high volume.
Traders should now look for long-biased trades in PAYC as long as it's trending above Wednesday's intraday low of $13.92 or above its 50-day at $13.70 and then once it sustains a move or close above those breakout levels with volume that's near or above 97,622 shares. If that breakout hits soon, then PAYC will set up to re-test or possibly take out its next major overhead resistance levels at $16.06 to $16.69, or even its all-time high at $17.92.
Read More: Do You Own These 5 Toxic Stocks? Watch Out!
Hyperion Therapeutics
Hyperion Therapeutics (HPTX), a commercial biopharmaceutical company, focuses on the development and commercialization of therapeutics to treat disorders in the areas of orphan diseases and hepatology. This stock closed up 4.5% at $24.57 in Wednesday's trading session.
Wednesday's Volume: 248,000
Three-Month Average Volume: 131,695
Volume % Change: 85%
From a technical perspective, HPTX ripped higher here right above some near-term support at $23 with above-average volume. This move briefly pushed shares of HPTX back above its 50-day moving average of $24.88, before the stock closed just below that level at $24.57. This strong trend to the upside on Wednesday is starting to push shares of HPTX within range of triggering a near-term breakout trade. That trade will hit if HPTX manages to take out its 200-day moving average of $25.17 to some more near-term overhead resistance at $26.10 with high volume.
Traders should now look for long-biased trades in HPTX as long as it's trending above Wednesday's intraday low of $23.43 or above more near-term support at $23 and then once it sustains a move or close above those breakout levels with volume that's near or above 131,695 shares. If that breakout gets underway soon, then HPTX will set up to re-test or possibly take out its next major overhead resistance levels at $28 to $29, or even $30.
Read More: Triple Your Gains With These 5 Cash-Rich Companies
Globus Medical
Globus Medical (GMED), a medical device company, focuses on the design, development and commercialization of musculoskeletal implants that promote healing in patients with spine disorders. This stock closed up 2.3% at $18.96 in Wednesday's trading session.
Wednesday's Volume: 908,000
Three-Month Average Volume: 606,181
Volume % Change: 50%
From a technical perspective, GMED trended notably higher here with above-average volume. This stock recently gapped down sharply from around $23 to $17.45 with monster downside volume. Following that move, shares of GMED have started to uptick a bit off that $17.45 low and it's quickly moving within range of triggering a major breakout trade. That trade will hit if GMED manages to take out Wednesday's intraday high of $19.13 to some more near-term overhead resistance levels at $19.46 with high volume.
Traders should now look for long-biased trades in GMED as long as it's trending above Wednesday's intraday low of $18.44 and then once it sustains a move or close above those breakout levels with volume that's near or above 606,181 shares. If that breakout materializes soon, then GMED will set up to re-fill some of its previous gap-down-day zone that started right around $23.
To see more stocks rising on unusual volume, check out the Stocks Rising on Unusual Volume portfolio on Stockpickr.
-- Written by Roberto Pedone in Delafield, Wis.
RELATED LINKS:
>>3 Stocks Under $10 to Trade for Breakouts
>>Trade These 5 Consumer Stocks for Gains in August
>>5 Large-Cap Stocks to Trade for Gains
Follow Stockpickr on Twitter and become a fan on Facebook.
At the time of publication, author had no positions in stocks mentioned.
Roberto Pedone, based out of Delafield, Wis., is an independent trader who focuses on technical analysis for small- and large-cap stocks, options, futures, commodities and currencies. Roberto studied international business at the Milwaukee School of Engineering, and he spent a year overseas studying business in Lubeck, Germany. His work has appeared on financial outlets including
CNBC.com and Forbes.com. You can follow Pedone on Twitter at www.twitter.com/zerosum24 or @zerosum24.Wednesday, August 6, 2014
3 Huge Stocks to Trade (or Not)
BALTIMORE (Stockpickr) -- Put down the 10-K filings and the stock screeners. It's time to take a break from the traditional methods of generating investment ideas. Instead, let the crowd do it for you.
From hedge funds to individual investors, scores of market participants are turning to social media to figure out which stocks are worth watching. It's a concept that's known as "crowdsourcing," and it uses the masses to identify emerging trends in the market.
Crowdsourcing has long been a popular tool for the advertising industry, but it also makes a lot of sense as an investment tool. After all, the market is completely driven by the supply and demand, so it can be valuable to see what names are trending among the crowd.
Read More: Warren Buffett's Top 10 Dividend Stocks
While some fund managers are already trying to leverage social media resources like Twitter to find algorithmic trading opportunities, for most investors, crowdsourcing works best as a starting point for investors who want a starting point in their analysis. Today, we'll leverage the power of the crowd to take a look at some of the most active stocks on the market today.
Without further ado, here's a look at today's stocks.
Read More: 5 Hated Stocks That Could Pop When the S&P Drops
Sprint
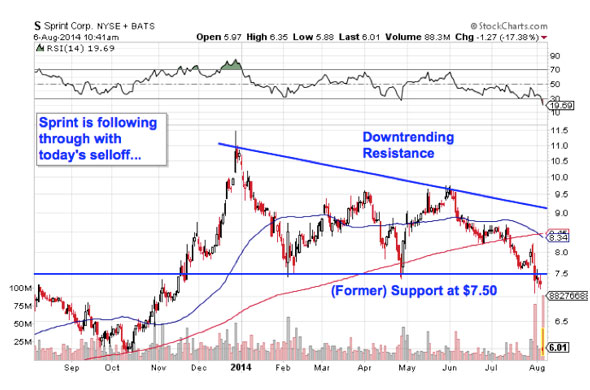
Nearest Resistance: $7.50
Nearest Support: $6
Catalyst: T-Mobile Talk Termination; New CEO
Shares of Sprint (S) are cratering this afternoon, down around 20% following news that the firm's talks to acquire T-Mobile (TMUS) have fallen through. According to Bloomberg, Sprint didn't think the acquisition was worth the regulatory barriers -- but investors clearly disagree with that conclusion based on today's selloff. Sprint is also getting extra attention this afternoon, following the announcement that Brightstar Corp founder Marcelo Claure will take over as CEO, replacing Dan Hesse, who has held the top spot since 2007.
From a technical standpoint, Sprint looked rough earlier in the week. Shares are just following through from a technical standpoint this afternoon, in large part thanks to the absence of buyers here.
While support is nearby at $6, it makes sense for buyers to stay away for the time being.
As of the most recently reported quarter, Spring was one of John Paulson's top holdings.
Groupon
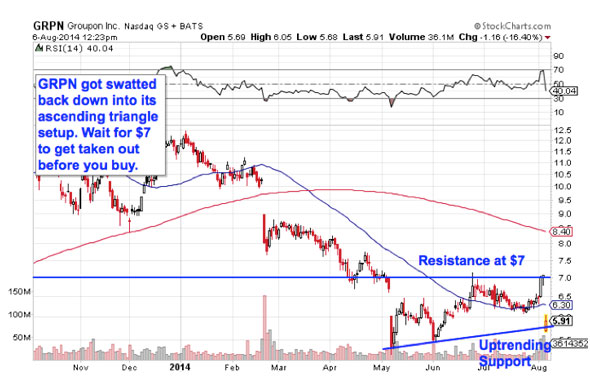
Nearest Resistance: $7
Nearest Support: $5.75
Catalyst: Q2 Earnings
It looks like the big spikes in put volume on Groupon (GRPN) earlier this week are paying off following second-quarter earnings. Groupon reported earnings of 1 cent per share for the quarter, coming in line with analysts' expectations. But the 16% selloff today is coming thanks to a lower than expected forecast for the third quarter. GRPN only expects to earn 2 cents in profits next quarter, short of Wall Street's 3-cent average estimate.
The swat lower in shares today is rough, but the technicals are holding. A breakout above $7 is still the most important buy signal to watch for this summer. Until it happens, nothing has changed technically here.
Cognizant Technology Solutions
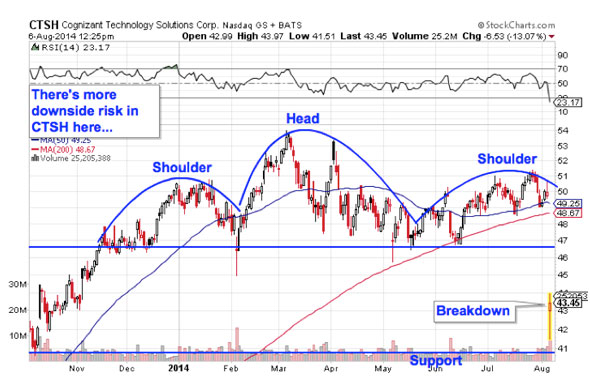
Nearest Resistance: $46.50
Nearest Support: $41
Catalyst: Q2 Earnings
IT outsourcer Cognizant Technology Solutions (CTSH) is down 12% on big volume this afternoon, following the firm's second quarter earnings call. While earnings beat expectations -- EPS came in at 66 cents, a 3-cent beat vs. estimates -- a cut to the firm's sales outlook for the third quarter is driving the selloff in this $26.6 billion technology name.
The technicals look rough in CTSH right now. Today's gap lower triggered the breakdown below key support at $46.50, a move that's signaling a long-term sell in CTSH. Support at $41 looks like the next stop for investors -- caveat emptor.
Read More: Warren Buffett's Top 10 Dividend Stocks
-- Written by Jonas Elmerraji in Baltimore.
RELATED LINKS:
>>3 Stocks Under $10 Making Big Moves Higher
>>5 Tech Trades Ready to Move
>>3 Stocks Rising on Big Volume
Follow Stockpickr on Twitter and become a fan on Facebook.
At the time of publication, author had no positions in the names mentioned.
Jonas Elmerraji, CMT, is a senior market analyst at Agora Financial in Baltimore and a contributor to
TheStreet. Before that, he managed a portfolio of stocks for an investment advisory returned 15% in 2008. He has been featured in Forbes , Investor's Business Daily, and on CNBC.com. Jonas holds a degree in financial economics from UMBC and the Chartered Market Technician designation.Follow Jonas on Twitter @JonasElmerraji
Single Parents Choose College Savings Over Retirement
One upon a time, the American dream entailed getting a job, getting married, buying a house with a nice white picket fence, and saving up for retirement. All of these goals were part of a bigger vision — to enjoy the golden years without any financial stress. Now, with increasing education costs, many of today’s single parents are putting a greater emphasis on saving up for their children’s college education rather than their own retirement, a new Allianz study finds.
According to the new LoveFamilyMoney study, single parents prioritize college savings over retirement, causing them some stress. The study asked the participants what their motivation was for developing a future financial plan. Forty-five percent of the single-family respondents said that they were “saving for my kids’ education,” 26% of the "modern" families and 39% of the "traditional" families said the same.
“Single parents are forced to solve the retirement equation by themselves, which places tremendous pressure on their ability to find the right balance between saving for their children’s college expenses and saving for their own future,” said Allianz Life Vice President of Consumer Insights Katie Libbe. “Because they are on their own, single parents often lack the flexibility to address multiple goals, and therefore tend to have a more narrow focus on their savings priorities.”
The full LoveFamilyMoney set of studies polled more than 4,500 Americans and identified six different "modern" family structures: 1) multigenerational Families, where three or more generations lived in the same household. 2) single-parent families, one unmarried adult with a child under 18; 3) same-sex families; 4) blended families, where children from previous relationships are living with their parent and step-parent; 5) older parents with young children families, this includes parents who are 40+ and have a child five years old or younger; 6) boomerang families, with a child 21 to 35 who has left the home and then returned.
(Traditional families were defined as married, heterosexual couples with at least one child. They made up less than 20% of families in the study.)
Study respondents had at least $50,000 average annual income for each category identified. The single-parent cohort averaged nearly $85,000, and only an average of 6% of their income was derived from child support — 64% received no child support at all. This data incorporates both men and women.
In the U.S. at large, there are approximately 8.6 million single moms, according to Pew data from 2011 — and 2.6 million single fathers. The national median for single-mother families is $23,000; fathers have a higher income and are less likely to be living at the poverty line.
Despite the high average income in the study group, there are still no real savings in the retirement funds of many single parents. One reason could be the social pressure to overcompensate when providing for their children. Forty-five percent of single-parent families believe that is the parent’s responsibility to help their children become financially stable, Allianz found.
"While single parents have several options to help pay college expenses – including grants, scholarships, and student loans – they’re solely responsible for their own retirement savings,” added Libbe. “Depleting their nest egg to fund education costs can be dangerous. To avoid sacrificing retirement savings, a good plan may be to explore college saving and borrowing options first, then determine how those tactics fit with their larger savings strategy.”
---
Check out ‘Modern’ Families Struggle With Financial Security: Allianz on ThinkAdvisor.
Tuesday, August 5, 2014
4 Financial Lessons from 'Honey Boo Boo's' Mama June
 John Bazemore/AP You either know the show and love the family, or you're wondering what in the world a "Honey Boo Boo" is. For those in the latter camp, here's a little background. The hit TLC show "Here Comes Honey Boo Boo" follows June Shannon and her family in their daily routine of ridiculous antics. From marriage proposals on a pizza to dressing as the Kardashians for Halloween to having a pet pig named Glitzy, there's never a dull moment. Honey Boo Boo is the nickname of the youngest daughter, Alana, who rose to instant fame from her loud, proud and hilarious antics on an episode of TLC's "Toddlers and Tiaras." But beneath all the deep-Southern speak (which, thankfully, includes subtitles) and strange traditions, like egg-nogging (which is a gag-inducing game of bobbing for hot dogs in egg nog), June Shannon seems to possess more financial sense than many people in this grand US of A. Here's why, accompanied with some of her best tips. 1. Avoid Lifestyle Inflation Despite the success of "Here Comes Honey Boo Boo," June Shannon and her family have largely avoided lifestyle inflation. It wasn't until this year (season three) that the family was shown house hunting to upgrade their very modest home by the railroad tracks. When the show first aired in 2012, Rosie O' Donnell actually offered to buy the family a new home. But Mama June graciously turned down the offer, stating, "We're not looking for a handout." 2. Save With Coupons The family doesn't only live well within their means. Mama June finds ways to save extra money with her extreme couponing. One of her biggest tips is being organized. She keeps all of her coupons in a binder, dividing them by product, using plastic baseball card organizers. She also says the item that people most overspend on is probably laundry detergent. She recommends using coupons to buy the smaller bottles, which when put together, are the same size as a larger bottle, for less. 3. Budget With Your Children The family seems to practice itemized budgeting and is passing that trait on to the children. In one recent episode, when Mama June's oldest daughter, Anna, starts planning her wedding, June gives her a strict budget of $2,000. Anna has to report the cost of each and every item, and when it looks like she might go over budget, June tells her she'll have to cut a few things from the wedding. Once the budget is set, the only option is to make it work. Now that's a mama that sticks to her guns. 4. Invest for Your Family's Future When it comes to saving for the future, June Shannon seems to have it figured out. When the family receives money for appearing in an episode of their show, June puts most of it in equally-divided trust funds for her four daughters, as well as her granddaughter. The money will remain untouched until the girls either turn 21 or need it for their education. So let's recap. Mama June is self-sufficient, lives within her means, coupons, budgets, teaches her children about budgeting and saves for their futures. Many of us could benefit by taking a page out of her book -- at least financially speaking. More from Joanna & Johnny
•Dave Ramsey Totally Ruined This Guy's Life (and His Music) •Ups and Downs of Retirement Expenses: What Do You Need? •How to Land Posh Hotel Upgrades for $20
Friday, August 1, 2014
Boyd Gaming Proves Not Everyone Wins From Las Vegas Gambling Recovery
NEW YORK (TheStreet) -- Atlantic City may be on the verge of going bust due to casino overcapacity and new regional competition, but gambling in Las Vegas is hot. That is, for some companies.
Boyd Gaming (BYD), which operates nine hotels and casinos in Las Vegas, in addition to having a 50% membership interest in Atlantic City's Borgata, is an example of competitive pressures overshadowing a recovering gambling backdrop in Las Vegas. Investors should be particularly concerned.
Boyd Gaming posted adjusted earnings per share of 5 cents a share, or 3 cents below Wall Street consensus expectations as compiled by Bloomberg. The disappointing results were fueled by revenue and adjusted operating income declines at the company's Las Vegas Locals and Downtown (Vegas) segments, which theoretically should be partaking in the region's recovery.
Management signaled the situation is unlikely to reverse course in the near-term. Boyd Gaming lowered its full year adjusted operating income guidance to a range of $580 million to $600 million from $600 million to $620 million, citing weakness in casual play games and a "tough" operating environment.
Las Vegas Sands', on the other hand, reported hotel average daily room rate (ADR) increased a strong 8.8% in the second quarter, with revenue per available room (RevPar) increasing 6.9%. Gambling revenue was relatively flat year over year at $104.3 million.
Boyd's second-quarter performance runs counter to trends in the Las Vegas gaming market. In June, Las Vegas strip gambling proceeds spiked 22%, accelerating from 17.3% and 3.19% increases in May and April, respectively, according to Bloomberg data. Gaming revenue statewide in Nevada increased 14% in June, almost two times that of May, and far removed from April's 0.3% drop. Watch More: Norwegian Cruise Line's Upgraded Amenities Help to Boost Revenue (Exec Interview) The resurgence of gambling revenue in the state could partially be attributed to the attraction by consumers to room renovations by the likes of Las Vegas Sands (LVS) and Caesars Entertainment (CZR) as well as investments being made in new celebrity-chef inspired dining experiences and promotions. However, at the center of this renewed interest in gambling in the state is the recovering health of the Las Vegas economy. Although construction jobs, a key driver of gambling in Nevada, remain some 62% below the peak of 2006 per Bloomberg, the 2014 annualized gain for the sector's employment count has tallied 14%. The Las Vegas unemployment rate peaked in July 2010, and non-farm payrolls have improved sequentially in four of the past five months. All of this stands in stark contrast to Atlantic City, where announced closures of Showboat Casino, Trump Plaza, and potentially Revel, have been dominating the headlines. Revenue for Atlantic City has declined for seven straight years, falling to $2.8 billion in 2013. With high overhead, greater regional competition and burdensome interest payments, Atlantic City's casino owners simply are unable to achieve and sustain profitability. Read More: Symantec's Gillett Says Biggest Cyber Threat Isn't What You Think Along with the casino closures will come mass layoffs. The city's casinos account for about half of Atlantic City's jobs, or 5,883 jobs out of a total 13,500. With these layoffs imminent, a 14.9% jobless rate, more than two times the national average, in Atlantic City looks set to spike. Boyd Gaming is the owner of the third worst-performing stock year to date (-0.4%) among its peers MGM Resorts International (MGM) (+15.3%), Wynn Resorts (WYNN) (+16.44%), Las Vegas Sands (-6.04%), and Penn National Gaming (PENN) (-24.58%). Shares of Boyd Gaming fell 2.4% in after-hours trading following the earnings release and lowered full year profit guidance.